
Widgets
Catalog of available widgets and expected data sources.
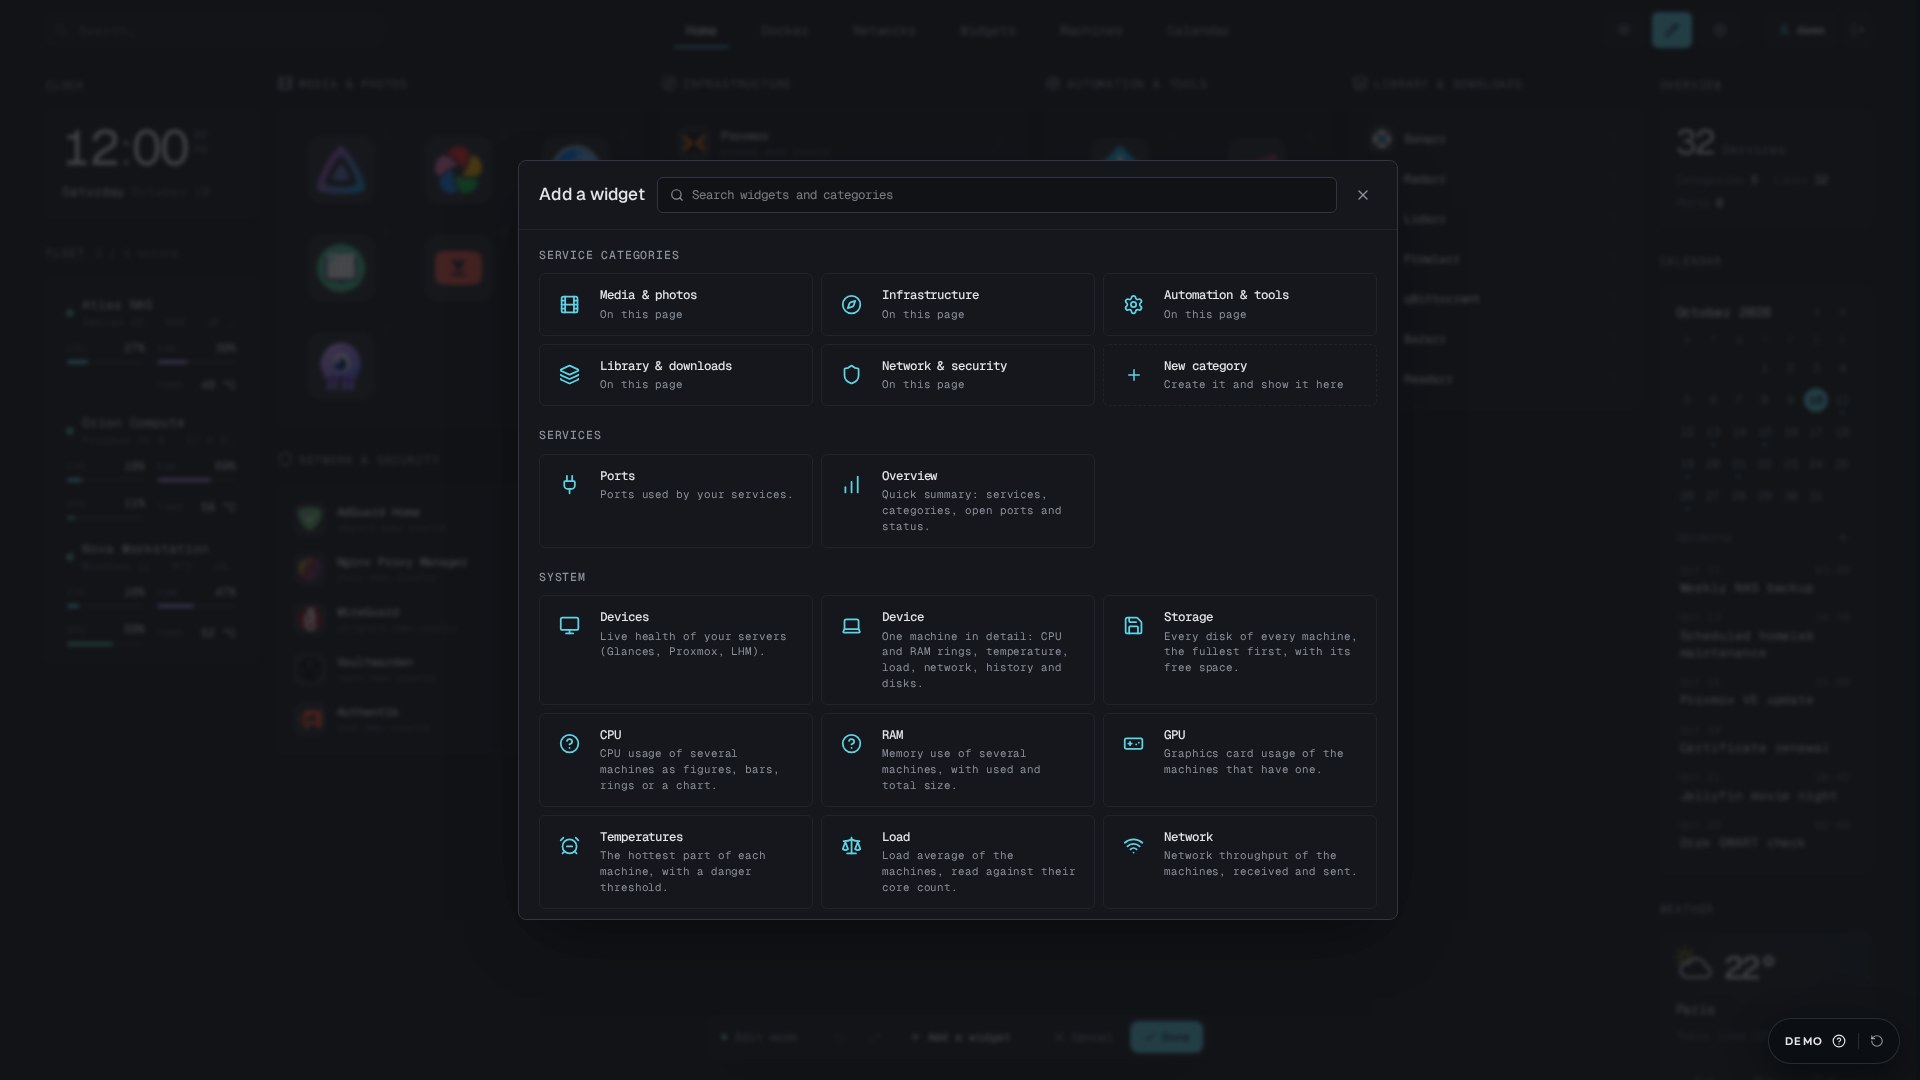
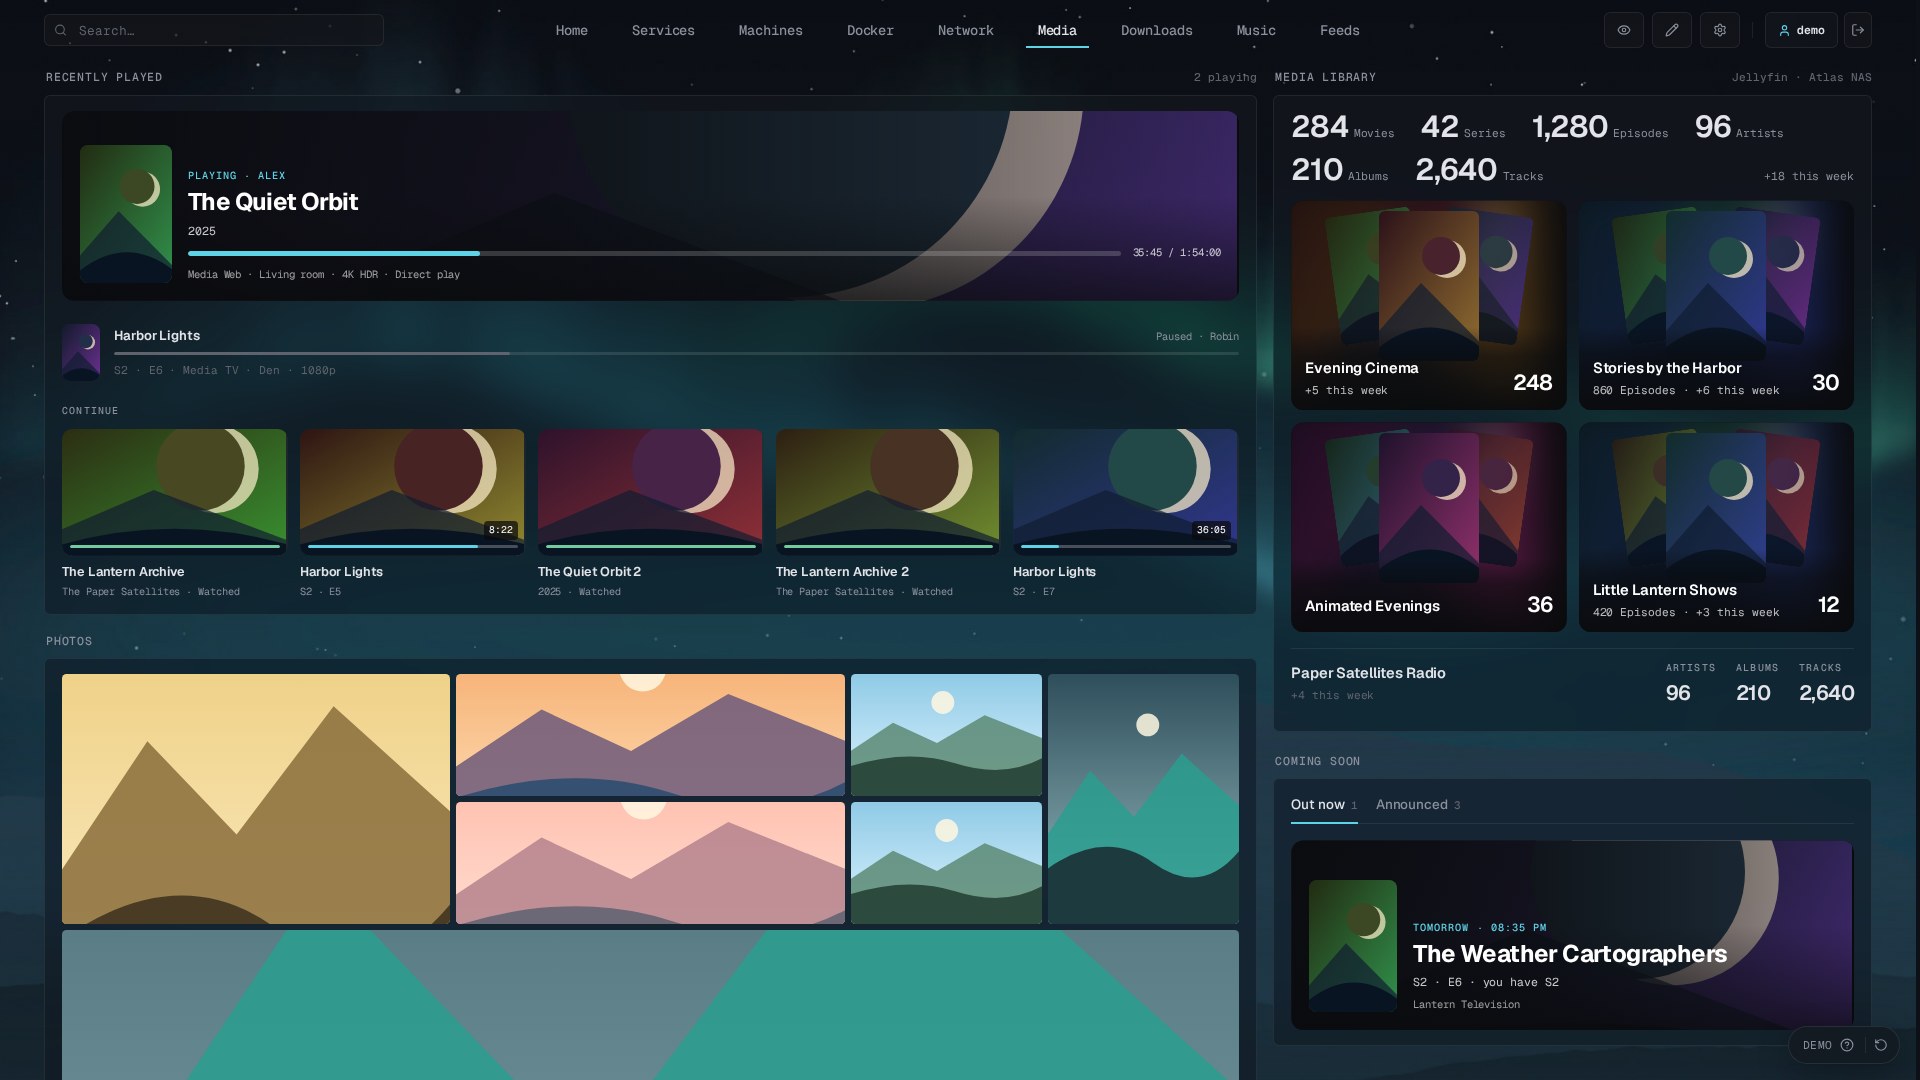
The 0.3.9 library contains 58 selectable widget types, out of 61 registered types. Add them to any editable page and configure each instance with existing categories, machines or shared connections. Removing a widget keeps its data source.
In the library, click several widgets to select them, then Add: they are placed one after the other at the first free spots.
Catalogue
| Group | Widgets | Guide |
|---|---|---|
| Services | Service category, Ports, Overview | Services |
| System | Devices, Device, Storage, CPU, RAM, GPU, Temperatures, Load, Network, UPS, Syncthing | Devices, UPS, Syncthing |
| Docker | Docker containers, Docker actions, Docker hosts, Container list, Docker explorer, Container updates | Docker, Container updates |
| Network | Network graph, Tailscale VPN, Network tools, Network topology, Ad blocking (DNS), VPN, Internet speed, Uptime | Network, Tailscale, DNS, Gluetun, Speedtest Tracker, Uptime Kuma |
| Media | Recently played, Recently added, Media library, Coming soon, Requests, Reading | Media, Coming soon, Seerr, Reading |
| Downloads | Download queue, Downloads, Indexers, *arr status | Downloads |
| Music | Listening, Music activity, Music library, Most played, Playlists | Music |
| Content | News feeds, Markets, Quotes, Photos, Photo library stats, Bookmarks, Custom API, Web page, Notifications | Feeds, Markets, Quotes, Photos, Bookmarks, Custom API, Web page, Notifications |
| Gadgets | Clock, Calendar, Weather, Notes, To-do, Countdown | This page, Calendar, Weather, Notes and tools |
The internal device-chart and spacer types are not selectable library entries. docker-summary stays internal for older layouts that still contain the former counters widget. Older saved layouts remain compatible. For empty widgets, check the selected resource and integration first. See monitoring sources, Docker, pages and integrations. Enter credentials only in designated connection fields, never in titles, links or CSS.
Every size
Every widget fits every width, from 3 columns (a quarter of a phone) to the whole page, and lays itself out more compactly when narrow: secondary columns move under the title or give way, numbers wrap instead of overlapping. The Docker explorer, the network topology and the web page start at 6 or 12 columns, as they mean nothing smaller. The clock and the weather can have their own style per widget, or follow Settings → Widgets. The clock can also be aligned left, centred or right.
Where settings live
- Settings → Integrations holds connections to services: monitoring sources, Docker hosts, Tailscale/Headscale, Pi-hole and AdGuard Home.
- Settings → Widgets holds what a widget type shares: feeds, the market watchlist, quotes, weather cities, the calendar address.
- The pencil of a widget in page edit mode sets only how that widget looks and which saved items it shows. Its dialog links to the matching settings page.
A widget that is not set up yet says what it needs and offers one button to the right place. Content widgets fit from the narrowest width; cards and tiles show a page at a time (or in a scrolling row) with an adjustable number per page. See news feeds, markets, quotes, bookmarks, photos and Pi-hole, AdGuard Home and Technitium.
Clock
Clock settings under Settings → Widgets → Clock share one timezone and style across Clock widgets. An empty timezone uses each browser’s local time. Choose Default, Minimal, Accent or Stacked.
Calendar events
Administrators can click a day to add an event, choose its date and time or mark it as all-day. Click an event in the upcoming list or month grid to open its details, then edit its title, description, date or time, or delete it after confirmation. The same actions work in calendar widgets on any page. Canceling leaves the event unchanged; failed saves or deletions show an error and keep the dialog open. Imported ICS events and events viewed without administrator access remain read-only.
Storage volume order
The Storage widget groups volumes by host by default, including widgets saved before this option existed. Hosts follow the configured machine order; volumes within each host follow their names (for example, volume2 before volume10). Enter page edit mode and open the Storage widget settings to choose By host, By usage or Manual. By usage restores the global fullest-first order. Save the widget settings, then save the page to keep the choice. Chart colours stay attached to each host when the order changes. This changes presentation only; volumes and monitoring connections are not modified.
Manual metric order
In page edit mode, drag the small handles to reorder readings in CPU, RAM, GPU, temperature, load and network widgets, in figure, bar and ring displays where offered. The single-machine widget supports the same operation within each display group. Keyboard: Space picks up a reading, arrow keys move it, Space drops it, Escape cancels. Save the page to keep the order; canceling page edits restores it. Each widget keeps its own order without changing the shared machine list.
Storage requires Manual in its volume-order setting before handles appear. By host and By usage disable dragging. Returning to Manual restores its saved order; temporarily missing readings keep their place, and new readings follow existing ones. Charts keep automatic series order and have no drag handles.
In the single-machine widget, the named group handles also move the Ring, Figure, Bar and Chart blocks above or below each other without converting any reading. Charts move as one block with their range controls and history. Metric handles still reorder readings within their own display group. The initial layout is preserved until a group is moved. Group order is saved with the page and restored if a temporarily hidden group returns.
CPU/GPU metric headings identify the measure without repeating a generic CPU or GPU caption underneath. In the GPU-temperature widget, the optional GPU model shows a reported model such as RTX 4070; multiple GPUs retain distinct labels even when that extra line is hidden.
In bar displays, Device and Metrics widgets keep the name on the left and all statistics on the right. They share one line when space permits and wrap only when needed, keeping captions readable and values complete.